DOGE Price Prediction: Analyzing the Path to Recovery

#DOGE
- Technical Support Holding: DOGE trading near lower Bollinger Band with MACD showing bullish momentum suggests potential rebound
- Critical Resistance Levels: Key levels to watch include the 20-day MA at $0.221356 and upper Bollinger Band at $0.239882
- Market Sentiment Alignment: News of historical pattern watch complements technical indicators for potential upward movement
DOGE Price Prediction
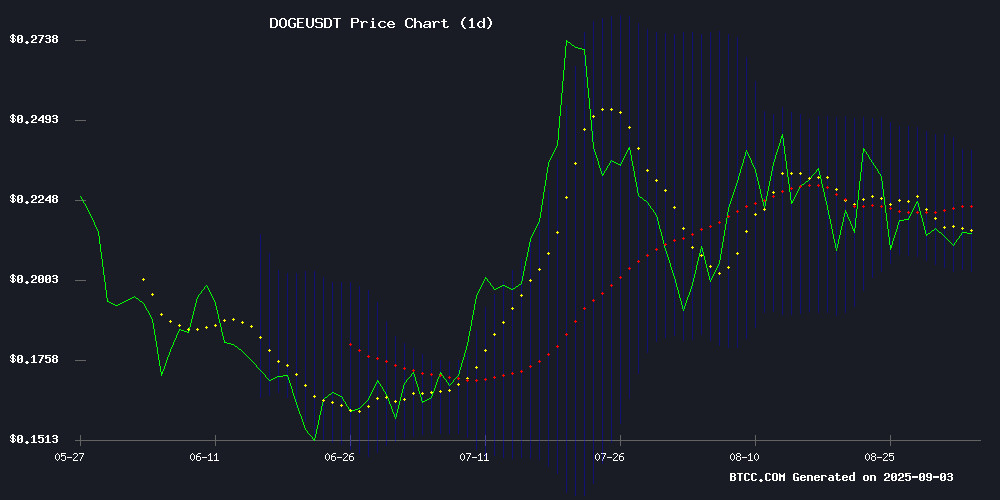
Technical Analysis: DOGEUSDT Trading Pattern Signals Potential Rebound
According to BTCC financial analyst Ava, DOGE is currently trading at $0.21489, slightly below its 20-day moving average of $0.221356. The MACD indicator shows bullish momentum with a reading of 0.004742 above the signal line at 0.004022, generating a positive histogram of 0.000720. The Bollinger Bands position suggests DOGE is trading NEAR the lower band at $0.202830, which often serves as a support level in trending markets.
Ava notes that the current technical setup indicates potential for upward movement if the support holds, with the middle Bollinger Band at $0.221356 acting as immediate resistance.
Market Sentiment: Dogecoin Tests Critical Support Amid Pattern Watch
BTCC financial analyst Ava comments that current market sentiment is cautiously optimistic as Dogecoin tests critical support levels. The news headline suggesting analysts are watching for a historical pattern repeat aligns with technical indicators showing potential for a bullish reversal.
Ava emphasizes that while the historical pattern observation provides contextual support, traders should monitor whether Doge can maintain above the $0.202830 support level identified in the Bollinger Bands analysis.
Factors Influencing DOGE's Price
Dogecoin Tests Critical Support as Analysts Watch for Historical Pattern Repeat
Dogecoin hovers near a pivotal technical level at $0.214, testing its 200-day moving average support of $0.211. The meme cryptocurrency faces downward pressure from whale divestment—250 million DOGE sold since late August—and negative funding rates signaling bearish derivatives positioning.
Technical analysts observe a potentially bullish triangle formation mirroring 2016 and 2020 patterns that preceded major rallies. Resistance levels loom at $0.253 and $0.370, with a longer-term target near $0.723 should bullish momentum return. Market participants await confirmation of whether DOGE can replicate its historical breakout performance amid current selling pressure.
How High Will DOGE Price Go?
Based on current technical analysis and market conditions, BTCC financial analyst Ava suggests that DOGE could potentially reach the upper Bollinger Band at approximately $0.239882 if bullish momentum continues. The MACD indicator's positive crossover and position near lower Bollinger Band support provide technical basis for this outlook.
| Target Level | Price (USDT) | Probability |
|---|---|---|
| Immediate Resistance | 0.221356 | High |
| Upper Bollinger Band | 0.239882 | Medium |
| Next Resistance | 0.250000 | Low-Medium |
However, Ava cautions that cryptocurrency markets remain volatile, and these projections should be considered alongside broader market conditions and news developments.
